









The Napier AI / AML Index 2026–2027 finds that a country’s anti-money laundering (AML) spend is shaped as much by its neighbours and political alignments as by its own domestic risk.
Countries that border heavily sanctioned states spend more on AML compliance than their domestic risk alone would predict. That is the central finding of the border line of financial crime, new analysis by Dr. Janet Bastiman, Chief Data Scientist at Napier AI.
The Index is produced in partnership with GlobalData and ranks 42 markets. It estimates that $5.09 trillion (USD), or 4.30 per cent of global GDP, was laundered in 2025. That is 3.84 per cent less than the year before, and the first fall in the Index’s three editions. The burden of fighting it is not shared evenly, though. Geography explains why the cost of compliance is not evenly distributed, more than conventional analysis allows.
Key takeaways
- Compliance spend does not track domestic risk alone. Exposure to heavily sanctioned neighbours and geopolitical alignment both shape it.
- Poland is the clearest overspender. Its compliance spend equals 40.40 per cent of its estimated money laundering losses, against an ideal band of 1 to 3 per cent.
- France, Germany and the Netherlands also overspend, despite geography and voting records similar to their peers.
- The US spends less than its sanctions position would predict, although its ratio still sits above the ideal band.
- Spend lags politics: today’s compliance budgets reflect yesterday’s sanctions map.
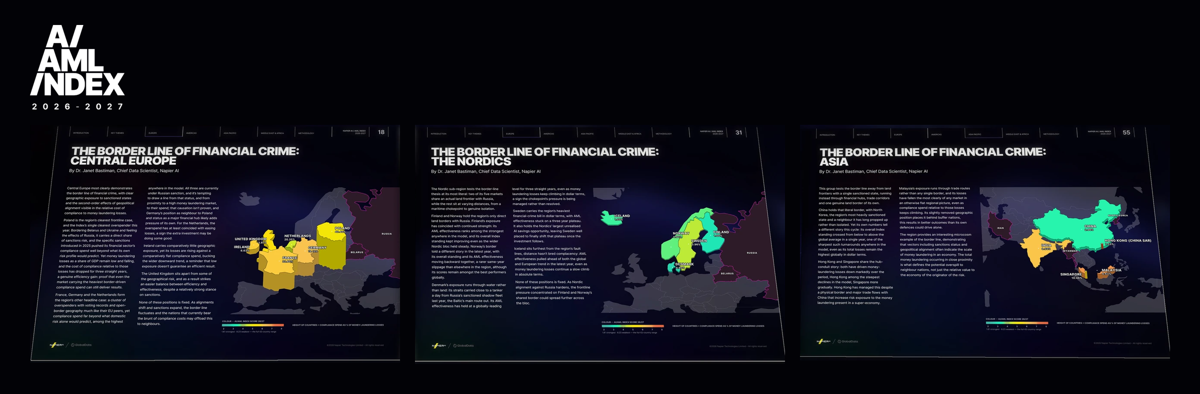
Download the Napier AI / AML Index 2026–2027 to explore the regional border line maps in full.
What is the border line of financial crime?
The border line of financial crime is the Index’s term for a pattern that appears when compliance spend is mapped against geography and geopolitics.
Nations that border, or are politically aligned with, heavily sanctioned states inherit a share of those states’ risk. This happens regardless of their own crime levels or regulatory approach. Predicate crimes, illicit cash flows and pressure on correspondent banking relationships cross national frontiers and digital payment corridors. Neighbouring financial systems then pay to defend against them.
When we began looking at the outliers (the countries spending disproportionately. relative to their economic size or apparent domestic risk) geography kept emerging as the explanatory variable,” says Dr. Bastiman. “It is not that these nations have worse institutions or weaker political will. They are simply closer to the source of the problem.”
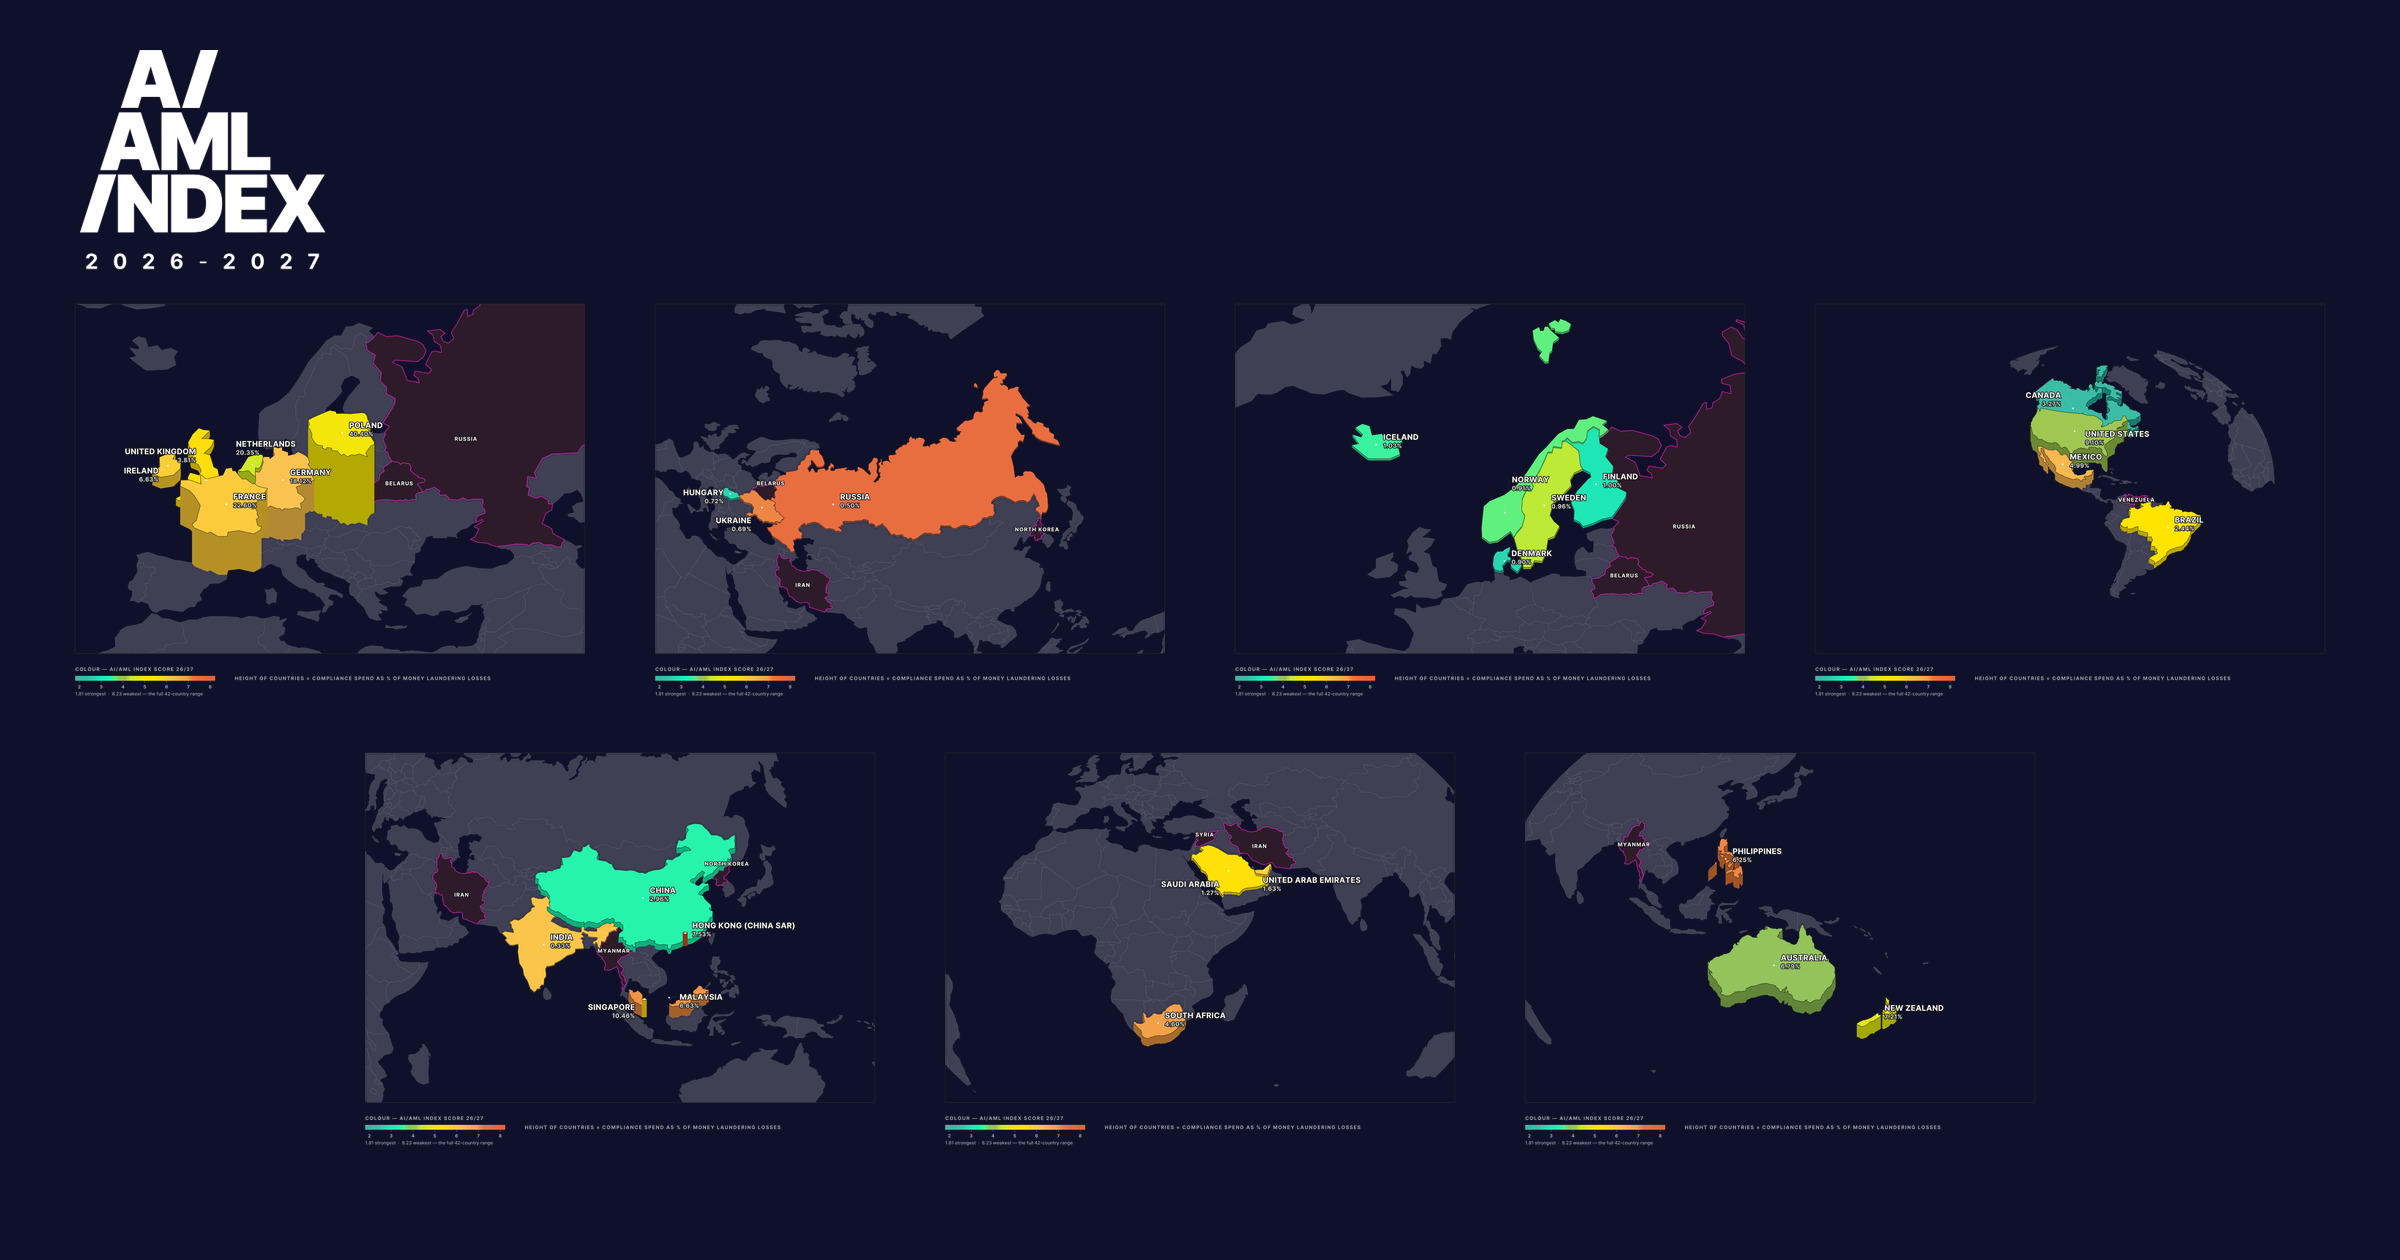
The research measures each market’s compliance cost as a ratio of its estimated money laundering losses. It plots that ratio on regional relief maps, where height shows the ratio and colour shows the market’s Index score. Geopolitical alignment is measured through each country’s United Nations General Assembly voting record against the states on its own sanctions list.
Which countries overspend on AML compliance?
The Index sets an ideal cost-to-loss band of 1 to 3 per cent. This is the range in which spend is proportionate to the problem it addresses.
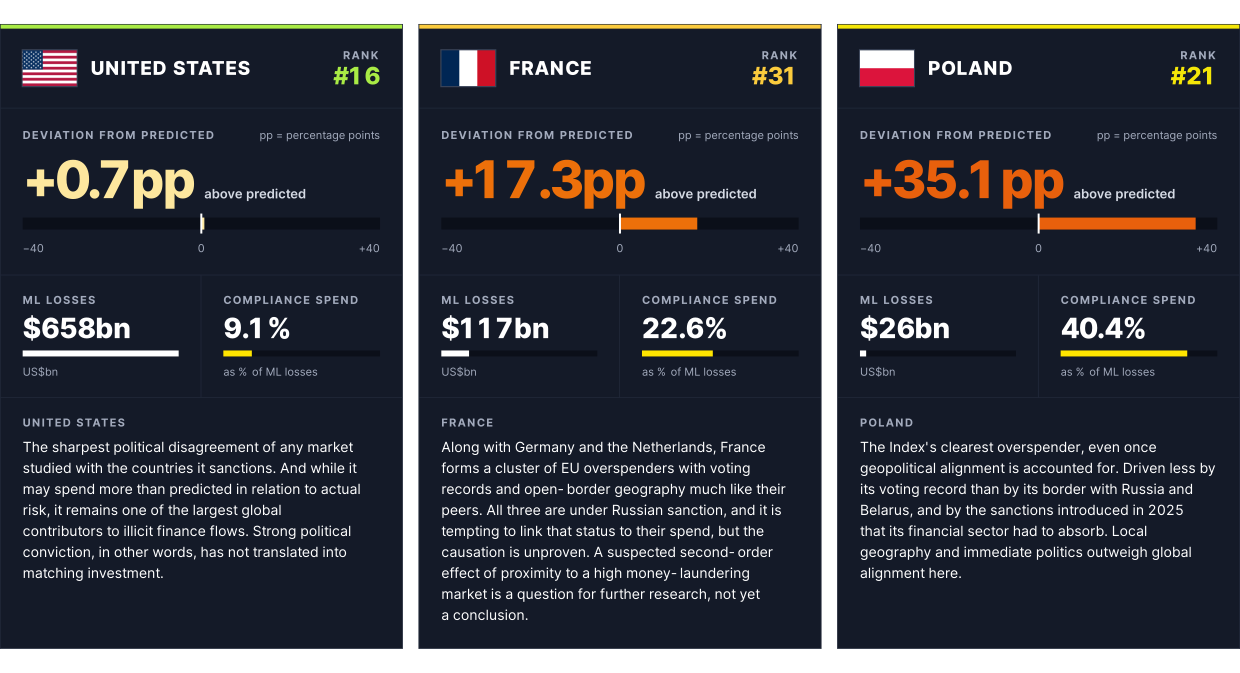
Poland sits furthest above that band. Its compliance spend equals 40.40 per cent of its estimated money laundering losses, the highest ratio in the Index, and it borders both Russia and Belarus. Its ratio has nonetheless fallen for three consecutive years.
France (22.60 per cent), the Netherlands (20.35 per cent) and Germany (18.12 per cent) also spend well above the band. Their geography and voting records are broadly similar to peers that spend less. Proximity alone does not explain every case, which is why the research treats geography and alignment as two separate factors.
Does political alignment with sanctioned states lower compliance spend?
Not in the way many would expect. A common assumption is that allies of sanctioned states underspend. The Index finds that closer alignment shows a weak positive correlation with overspend, not underspend.
The report offers two explanations: sanctions lag and institutional inertia. Compliance budgets are built in response to earlier sanctions regimes and take time to unwind. Spend today therefore reflects yesterday’s politics.
The US shows the other side of the pattern. It holds the sharpest political disagreement with the states it sanctions, yet it spends less than the model predicts for that position. Its ratio of 9.10 per cent still sits above the ideal band, so this is not underspending in absolute terms. It is spend that does not scale with sanctions exposure the way the model expects.
What does the border line mean for compliance teams?
The border line shifts the question compliance teams need to ask. Exposure to sanctions risk is no longer only about a market’s own controls; it also depends on who that market’s neighbours and allies are.
“If you’re a bank operating in a country that is two borders from a sanctioned state, you may be carrying risk that your current framework isn’t calibrated to identify,” Dr. Bastiman says. “The conventional model treats each jurisdiction as a self-contained unit. The data suggests that it is no longer sufficient, with second-order effects hopping borders and disseminating financial crime risk further than historically anticipated.”
In practice, that raises three questions for compliance leaders:
Exposure
Which of your payment corridors and correspondent relationships run through markets that border, or are aligned with, sanctioned states?
Calibration
Do your risk models treat geopolitical adjacency as a variable in its own right, or only domestic risk factors?
Timing
Is your compliance spend set by today’s sanctions map, or by last year’s? How quickly can you reconfigure your screening policies to match current risk realities?
AI-driven compliance can help close these gaps, but only if the models underneath are calibrated to the right risks. The Index puts Napier AI’s modelled potential AI-driven compliance savings across its 42 markets at $143.08 billion (USD). In this year’s expert interviews, 68 per cent of respondents said their AML engine is ready for the non-functional and data demands of AI. So why have they yet to capitalise on the potential TCO benefits?
Will the border line of financial crime move?
Because spend lags politics, the border line shifts as sanctions regimes and alliances change. A market outside today’s high-spend zone can be pushed into it by a new sanctions package rather than by a change in its own policy.
“Geopolitical risk has always had financial crime consequences,” Dr. Bastiman says. “What we can now show is that those consequences are measurable, mappable, and to some extent, predictable. The borderline shifts. The question is whether institutions and regulators are looking at the same map, and if they can reflect that shift into financial crime defenses as quickly as the risk fluctuates.”
For financial institutions, the question is no longer only how much they spend on compliance. It is whether that spend addresses the real risk.
Download the Napier AI / AML Index 2026–2027 to see where your markets sit on the border line. It includes profiles for all 42 markets and the regional relief maps behind this analysis.
Frequently asked questions
What is the Napier AI / AML Index?
The Napier AI / AML Index is annual research ranking 42 markets on how effectively they combat money laundering. It is produced by Napier AI’s data science team, led by Dr. Janet Bastiman, in partnership with GlobalData.
How much money is laundered globally each year?
The Napier AI / AML Index 2026–2027 estimates that $5.09 trillion (USD), or 4.30 per cent of global GDP, was laundered in 2025. That is a fall of 3.84 per cent on the previous year, and the first fall recorded in the Index’s three editions.
Which country spends the most on AML compliance relative to its losses?
Poland. Its compliance spend equals 40.40 per cent of its estimated money laundering losses, the highest ratio in the Index and well above the ideal band of 1 to 3 per cent. Poland borders both Russia and Belarus.
Why do countries near sanctioned states spend more on AML?
They inherit a share of their neighbours’ risk. Predicate crimes, illicit cash flows and correspondent banking pressure cross borders and payment corridors, so neighbouring financial systems pay to defend against them. Spend also lags politics, reflecting earlier sanctions regimes as well as current ones.
What is the ideal level of AML compliance spend?
The Napier AI / AML Index 2026–2027 sets an ideal band of 1 to 3 per cent of a market’s estimated money laundering losses. Spending above that band suggests potential over-spend; spending below it suggests under-investment relative to the problem.


