

.svg)


The Napier AI / AML Index calculates the intersection of efficiency and effectiveness in financial crime compliance. But in the drive for efficiency, we cannot lose sight of the greatest cost when it comes to financial crime: the impact on society.
In this year’s research, we honed in on the economics of illicit finance, to understand why some nations report higher than average losses to money laundering despite best efforts. Why is it that some markets both spend disproportionately on compliance efforts and see large percentages of their economies siphoned off by organised crime?
Which countries overspend in the fight against financial crime?
The total cost of financial crime is crippling global economies, but when it comes to defending against threats, some markets feel that pain more acutely. Both in terms of absolute losses and the cost of compliance.
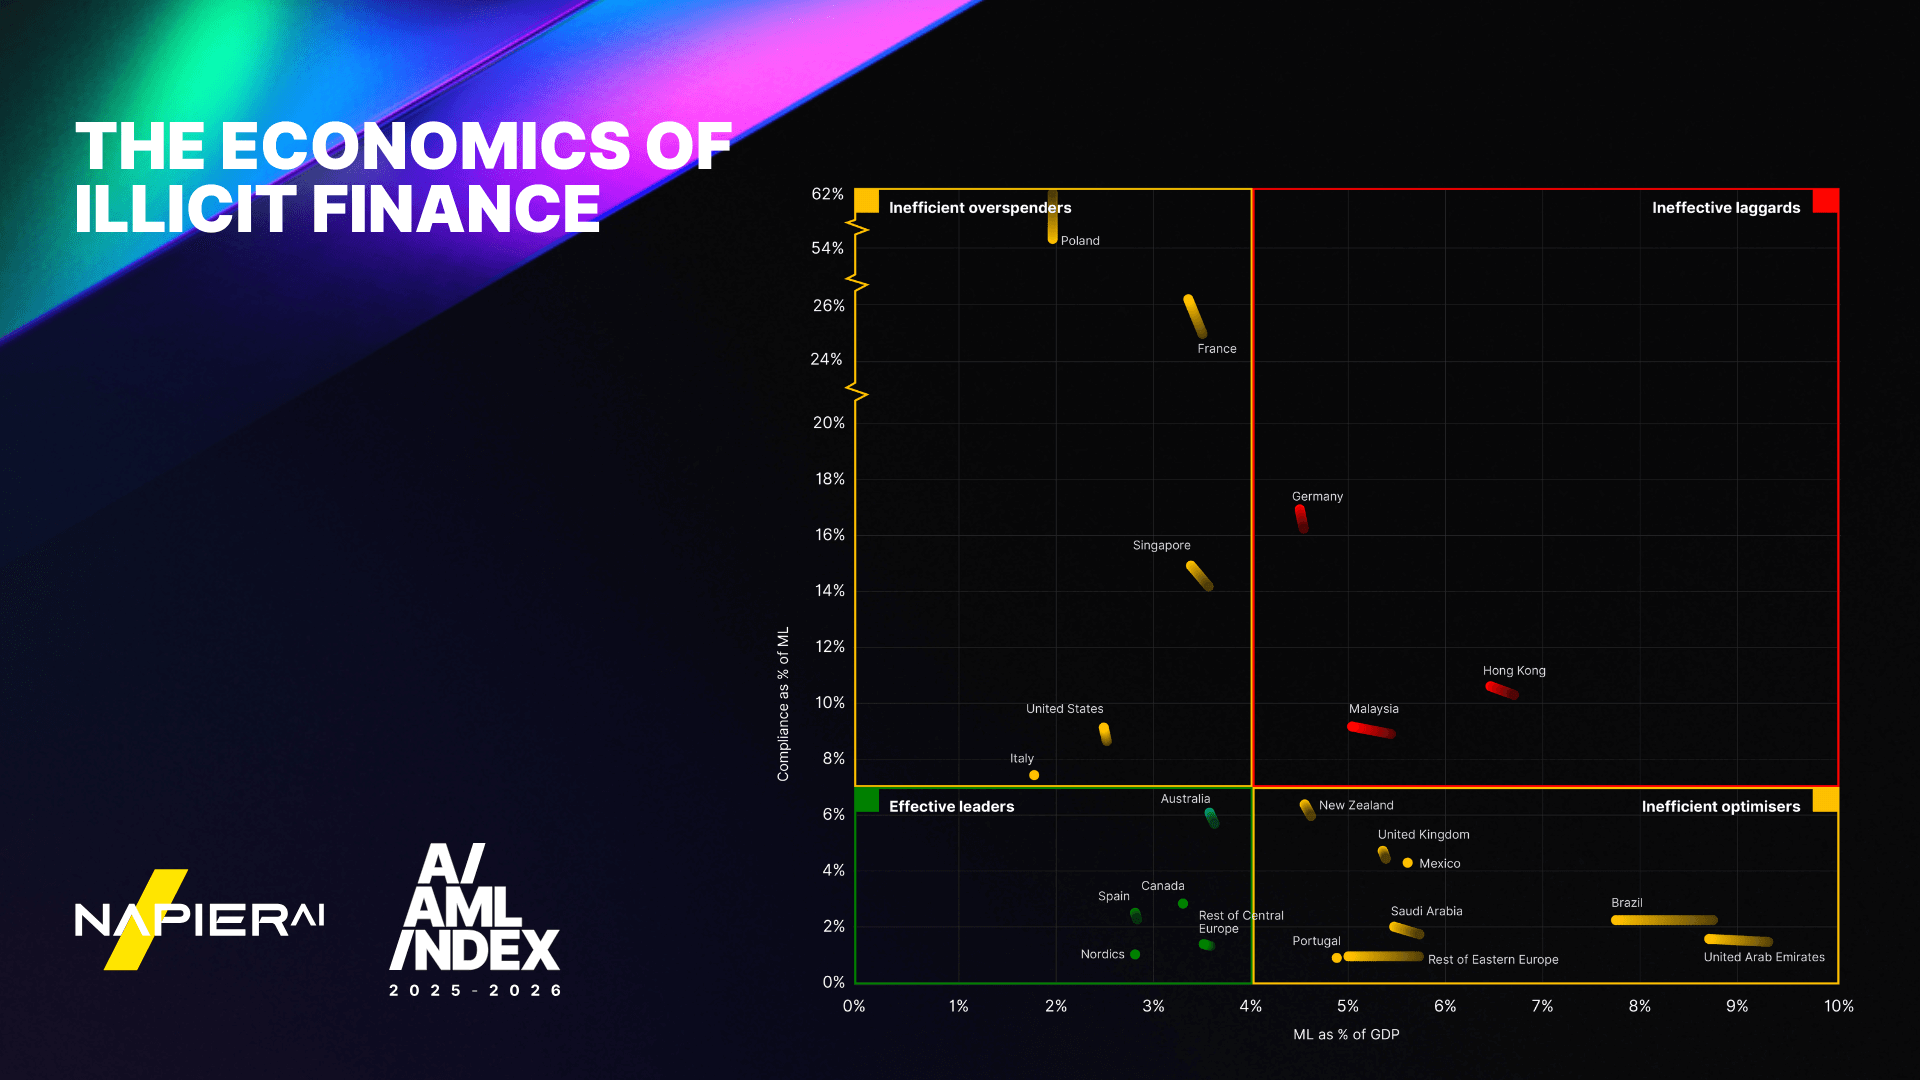
This AI / AML effectiveness quadrant shows compliance spend as a percentage of money laundered in the country, against money laundered as a percentage of Gross Domestic Product (GDP). Countries with the best ratio of spend to money laundered in the context of GDP, are labelled as ‘effective leaders’. This is because they are losing less than the global average of 5% of GDP to money laundering, while not overspending on AML.
Effective leaders
- Nordics
- Spain
- Canada
- Central Europe
- Australia
This category includes leaders like the Nordics, Canada and Spain, who have very effective compliance programmes. They represent the nations who have found the balance between efficient spend on AML and compliance, and effective programmes that genuinely prevent the placement, layering, and extraction of the proceeds of crime.
Positive progress
- Hong Kong
- Malaysia
- Eastern Europe
- Brazil
- United Arab Emirates
The quadrant also shows the direction of travel year on year. So, while Hong Kong and Malaysia are currently less effective than some nations, they are driving down the percentage of GDP lost to financial crime, trending in the right direction.
Inefficient overspenders
- Poland
- France
- Singapore
- United States
- Italy
Two countries to note here are France and Poland, which are spending so much on AML compared to the size of the problem, that they are quite literally off the charts. These countries have a lot of space to benefit from AI for increasing effectiveness and driving down the total cost of compliance.
Which countries suffer the highest financial crime losses?
While the absolute total losses to money laundering is an important metric, it is important to place this in the context of economies. Larger economies are likely to see higher total losses, as the global average is 5% of GDP equates to total money laundering losses.
.png)
Mature economies like the US absorb large absolute losses, ($729.71bn USD), but this only reflects 2.5% of GDP, indicating a relatively strong performance in AML efforts.
Some markets lose a disproportionate share of their economies to financial crime. With countries like South Africa and the United Arab Emirates (UAE) losing more than 8% of GDP (8.51% and 8.69% of GDP respectively).
Which countries spend the most on combating financial crime?
The total cost of compliance (TCO) score in the Index is designed to quantify the relative compliance spend to money laundering losses, in the context of the size of that national economy. The cost of compliance is modelled based on interviews with financial crime compliance leaders in those regions. Specifically, the scoring is based on how closely an individual country's ratio of cost of compliance to money laundering losses is to an ideal range for that ratio, based on the average ratio for countries with very low money laundering losses. Interestingly, this range is lower in the 2025-2026 Index than 2024-2025, owing to stronger money laundering prevention outcomes among the top-ranked countries. Many countries’ cost of compliance scores have changed significantly from last year.
.png)
South Africa reports a relatively high TCO (4.40) alongside high money laundering losses, with potential explanations including that true risk is getting lost in a sea of false positives alerts and requiring large numbers of FTEs to tackle the problem.
UAE on the other hand reports a good TCO (0.40) despite high money laundering losses, perhaps suggesting an underinvestment in addressing the issue possibly combined with a higher appetite for high-risk customers.
In Europe, France, Germany, and Netherlands, and in Asia, Singapore, Hong Kong, and Malaysia, all report higher than average TCO. But as leading lights their regional AML efforts, financial institutions in these markets are investing in the next generation of anti-money laundering and financial crime compliance technology. Although they currently report high TCO, we expect this to trend downwards as automations drive efficiencies, and to reduce money laundering losses with this new, advanced defences.
What do financial crime compliance professionals think about money laundering trends?
The reality is that illicit finance continues growing, identifiable by both the increasing losses, and the real-world feedback of anti-financial crime professionals:
- 85% identified more attempted money laundering in 2025 compared with the previous year.
- 85% reported that their organisations were generating more alerts in 2025 compared with the previous year.
- 81% reported that their organisations were identifying more attempted money laundering in 2025 compared with the previous year.
These practitioner insights highlight a need to change how we combat financial crime, moving from defence to attack, and moving upstream in the client and transaction lifecycles: identifying criminal behaviours earlier and addressing root causes rather than just symptoms.
Financial institutions cannot afford to settle for box-ticking when it comes to financial crime compliance, the scale of the problem is growing year-on-year so drastic improvements in operations and results are needed to reduce the total cost of compliance, as well as the economic and societal impact of financial crime.
Discover more insights in the Napier AI / AML Index 2025-2026


